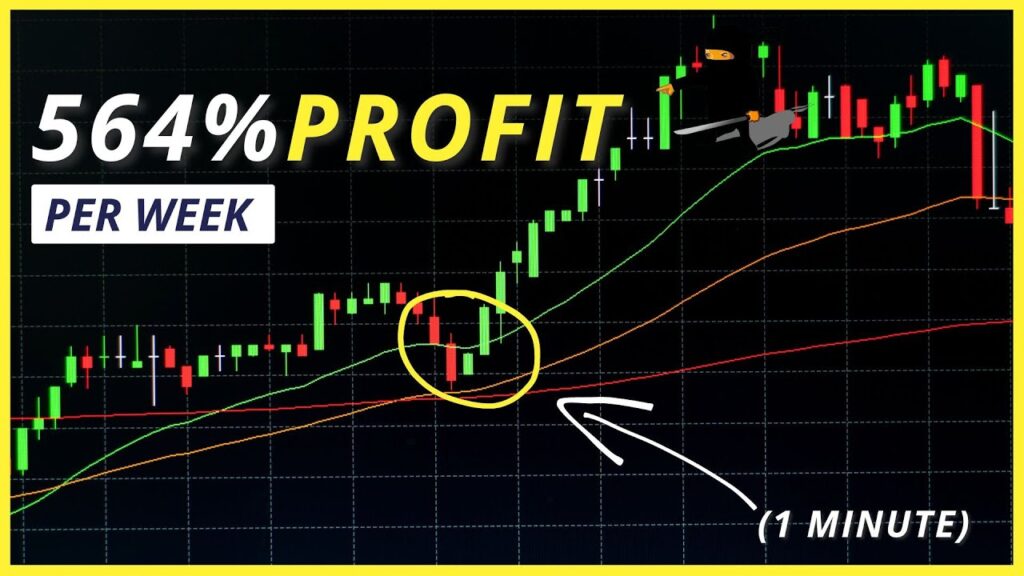
Welcome to Ninja Crypto Trader. In this video, I’m going to be showing you a the best crypto scalping trading strategy that you can use to increase your profits while trading crypto.
So before we get into this strategy, let’s first understand what scalping is.
Scalping is a trading strategy that specializes in profiting off of small price changes and making a fast profit off of reselling. This basically means that scalping is mainly done on small time frames.
Now the time frames that we are going to be using in this strategy are a one-hour chart and the five-minute chart. We won’t be trading on the one-hour chart; the one-hour chart will just be used as a guide to help us in this trading strategy.
So the three indicators involved in this strategy, and the first one we’re going to use, is the weighted moving average, or the WMA.
Now we are going to set the length of this indicator to 144. As you can see, it’s this blue line here on the chart.
The next indicator that we’re going to be using is a smooth moving average, or SMMA, and for this we are going to set the length to 5. As you can see, it’s this orange line here.
Now the reason we use these two indicators is to determine the trend, and how we’re going to read the trend from these two indicators is that when the SMMA crosses above the WMA, we’re in an uptrend, and when it crosses below the WMA, we’re in a downtrend. This is very important for where we’re going to move to, which is a five-minute chart where the trading will actually occur.
So before you actually start trading, you need to establish if you’re in an uptrend or downtrend. Here on the one-hour chart, we can see we are in a downtrend from this point at nine o’clock on June 5th. So we come to the five-minute chart and we can find where exactly we got into a downtrend.
At this point here, we can see the fifth of June around that nine o’clock is where we got into a downtrend, which correlated with what we saw on the one-hour chart.
Now the next indicator that we are going to bring in that will enable us to trade is the stochastic. We’re going to set the settings of this to length 5, smooth K 3, and the smooth D is a 3.
Those of you familiar with trading know that the stochastic is used to show overbought and oversold situations. The area above the purple area, basically 80 and above, is the overbought area, and 20 and below is the oversold area.
Many people use just these two only to trade in that they’ll wait for price to bounce off this WMA. Depending on whether you’re in a downtrend or uptrend, this WMA can be used as a point of resistance or support, and positions can be opened. But we are going to bring in the stochastic to be able to find better entry points with a higher probability of success.
What we want to find are points on the chart where the SMMA is below the WMA. Remember that on the one-hour chart, we are in a downtrend, so as we’re trading with the trend, we want to find areas where we are also in a downtrend on the five-minute chart.
As you can see here, the SMMA crosses below the WMA; that shows we are in a downtrend. The next thing we want to find are areas where the stochastic shows a cross in an overbought situation. When you’re looking at a downtrend, you want to be going short.
Here, we’re going to be looking at overbought situations, which signal a short trade. As you can see here, we have the SMMA below the WMA and we have a cross in the overbought situation, so a short trade can be opened at this point, and as you can see, the price followed.
There are other areas where we can see the same thing, for example here as well. This is not to say that this strategy is 100% accurate. Strategies are never 100% accurate, but it does have a high probability of working. As you can see here, we do have a cross in an overbought situation while the SMMA is below the WMA, but the price went up. Depending on how you manage your risks with your stop losses, this can still be a very powerful strategy that you can use to increase your profits.
For the long trade, it’s basically the inverse. What you want is for the SMMA to be above the WMA in both the one-hour and the five-minute charts, and you’re looking for a cross in the oversold zone. That will be a signal for a long trade.
You can use this and test it across various cryptocurrencies. Also, you can test different indicators other than the stochastic. This is not the only indicator that you can use with this strategy; you can find different indicators that you would like to use or that best suit your trading.
That is it with this scalping strategy. Now the platform I’m using is called Bybit, and if you want to go ahead and trade cryptocurrency with this platform, you can do that by clicking the link here. Note that new users get a free bonus on their first deposit.
If you enjoyed this video, please hit that like button, and don’t forget to subscribe and hit that notification bell so you don’t miss any more awesome crypto trading strategies.
By this, I am signing out.


