Welcome to Ninja Crypto Trader! In this video, I’m showing you the top three reversal trading strategies for day trading crypto. Before we get into these strategies, first, we have to understand what a reversal is.
A reversal is simply a change in the direction of a trend. This means you can go from an uptrend to a downtrend or from a downtrend to an uptrend. One common mistake that many people make is believing that when there is a significant movement in price in one direction, a reversal is going to occur. This, however, is not right as significant movements in price are mainly supported by a lot of momentum, meaning they’re following a certain trend. Thus, trading against this will be trading against the trend, which rarely works.
1. Break of Structure
Let’s move into the first strategy known as the Break of Structure. To use this strategy, first, we begin by finding a trend. So, we have a nice uptrend here, and what we’re going to do is draw a trend line to show this uptrend.
With uptrends, you have the characteristic of higher highs and higher lows. Next, we need to look for the point at which the price breaks the trend line. At this point, we have a break in the trend line where the price goes below the trend line. Now, this does not necessarily mean that the trend is reversing; we have to look for more signs to confirm our reversal.
Signs of Momentum Loss
We will look for three signs of momentum loss:
- Failure to Form a Higher High: When the price comes down and bounces off the trend line, the next high is lower than the previous high.
- Break in the Trend Line: The price breaks below the trend line.
- Current Downtrend: A downtrend is characterized by lower highs and lower lows.
This indicates that the trend has reversed, and you can now open a short position from this uptrend. Another sign to show momentum loss is looking for a double top or a triple top. As the price comes down and tries to bounce back up, it may form a double or triple top, signaling that the trend is about to reverse.
2. Bounce of a Key Level
The next strategy is known as the Bounce of a Key Level. A key level is basically an area where the price comes and bounces off, such as resistance or support. Here, we can see support at this level where the price bounced off. We can draw a support line to show this area of support.
As you can see, the price comes and bounces off this level and goes back up, bouncing off this level again. But, to confirm a reversal, we are going to use a certain indicator known as a Stochastic. The stochastic will show us overbought and oversold zones.
Using Stochastic
- Overbought Zone: Above the purple area.
- Oversold Zone: Below the purple area.
Change the settings to make the smooth K and smooth D the same (3,3) for better visualization. When the price bounces off the support and the stochastic moves out of the oversold zone into the middle area, that’s when you can put in your long trade as the trend will have reversed.
3. EMA Cross
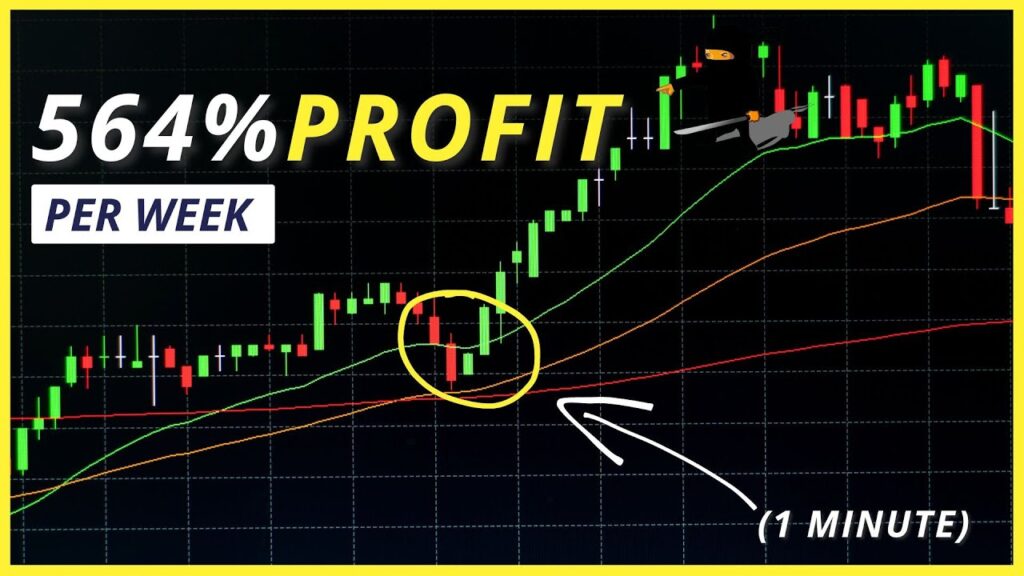
The third and final strategy is similar to the bounce of a key level with the stochastic, but instead of using the stochastic, we are going to use EMAs (Exponential Moving Averages), specifically the 10-period and 20-period EMAs.
Using EMAs
EMAs are used to show changes in trend through crosses. First, find another key level and draw a line to show this resistance point. The bounce does not necessarily mean the trend has reversed. We’ll look for a cross below the 20-period EMA, which shows we are in a downtrend, allowing you to open a short position for profits.
These are the three strategies that can help determine a reversal in day trading crypto.
If you like this platform and want to use it for trading crypto, I am trading on Bybit. You can create an account using the link in the description below. New users are given a bonus on their first deposit.
If you enjoyed this video, please hit that like button and don’t forget to subscribe and hit that notification bell so you don’t miss more awesome videos on trading strategies.
Signing out!


